//Skip to content
To build Test Plan in Jmeter Apache. We need several step to configuring the process.
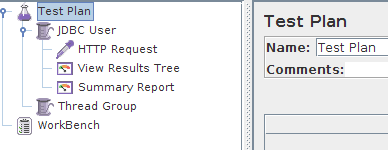
- Right click in Test Plan > Add > Thread Group
- Customize the Thread Group with your desire configurations like number of threads(User),The Ramp-Up Period, and loop count.
- Number of threads : Number of Users
- The Ramp-Up Period : This property tells JMeter how long to delay between starting each user. For example, if you enter a Ramp-Up Period of 5 seconds, JMeter will finish starting all of your users by the end of the 5 seconds. So, if we have 5 users and a 5 second Ramp-Up Period, then the delay between starting users would be 1 second (5 users / 5 seconds = 1 user per second). If you set the value to 0, then JMeter will immediately start all of your users.
- Loop Count : This property tells JMeter how many times to repeat your test

- Right click in Thread Group created before and go to > Add > Config Element > HTTP Request
- Name -- the name of this HTTP request. The name should be descriptive; remember that it is common to have multiple HTTP Request elements in a thread group.
- Server Name or IP -- the server name or the IP address of the machine running the application being tested.
- Port Number -- the port number used by the application. Normally, a Web application runs on port 80.
- Protocol -- the protocol used, either HTTP or HTTPS.
- Method -- the request method, either GET or POST.
- Path -- the path to the resource that will handle this request.
- Parameters -- the list of parameters sent with this request. Use the Add and Delete buttons to add and remove parameters.
- Send a file with a request -- simulate a file upload to the Web application.
- Retrieve all images and Java Applets -- download embedded content.
- Right click in Thread Group created before and go to > Add > Listener > View Result Tree.
- Right click in Thread Group created before and go to > Add > Listener > Summary Report.

Explanations:
Label: Recorded HTTP requests.
Samples: Samples denote to the number of http request ran for given thread.
Average: Average is the average response time for that particular http request. This response time is in millisecond.
Min: Min denotes to the minimum response time taken by the http request.
Max: Max denotes to the maximum response time taken by the http request.
Std.Deviation: This shows how many exceptional cases were found which were deviating from the average value of the receiving time. The lesser this value more consistent the time pattern is assumed.
Error %: This denotes the error percentage in samples during run. This error can be of 404(file not found), or may be exception or any kind of error during test run will be shown in Error %. In the above image the error % is zero, because all the requests ran successfully.
0 comments:
Post a Comment